Market Update - August 2024 - West Pasco FL
Curious about the latest trends in the local real estate market? Stay informed with the most up-to-date statistics, from average home prices to market inventory. Get the insights you need to make informed decisions in West Pasco, covering Holiday, New Port Richey, Port Richey, Hudson, and Spring Hills.
Video Summary
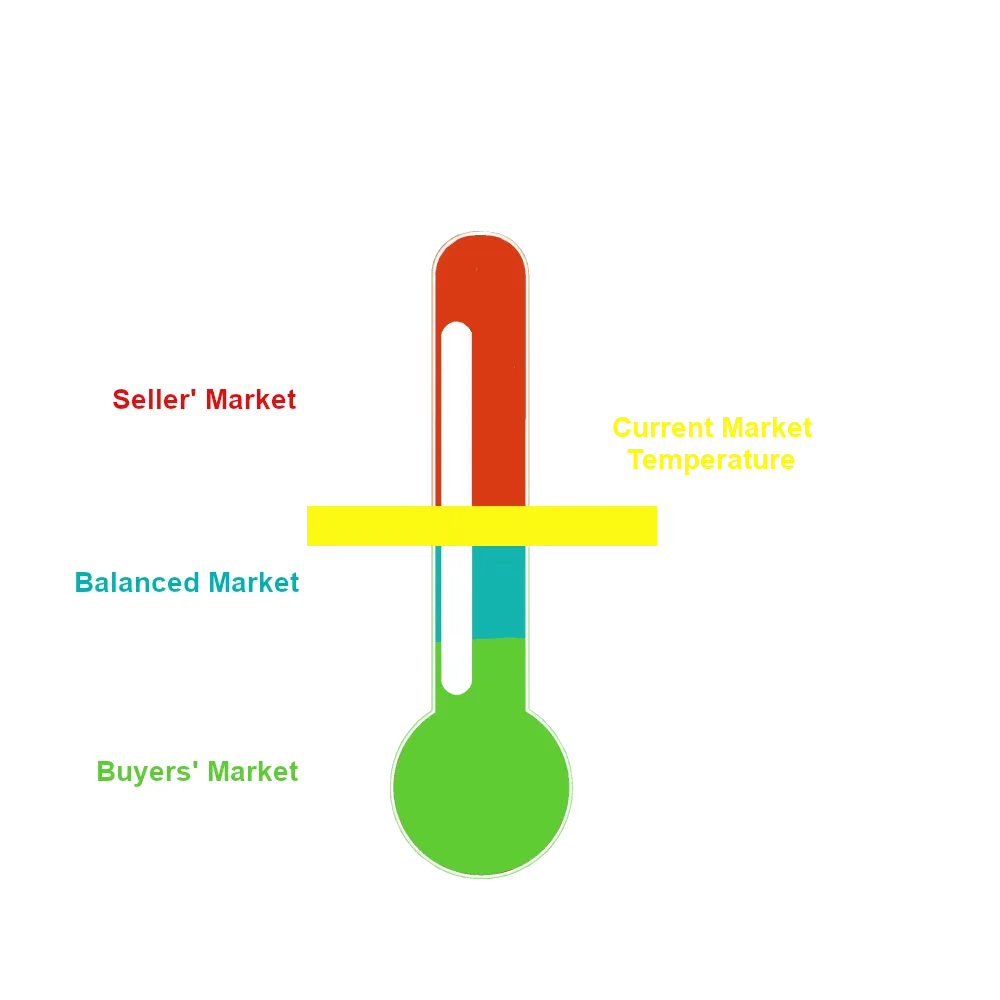
Market Temperature
Number of Active Listings
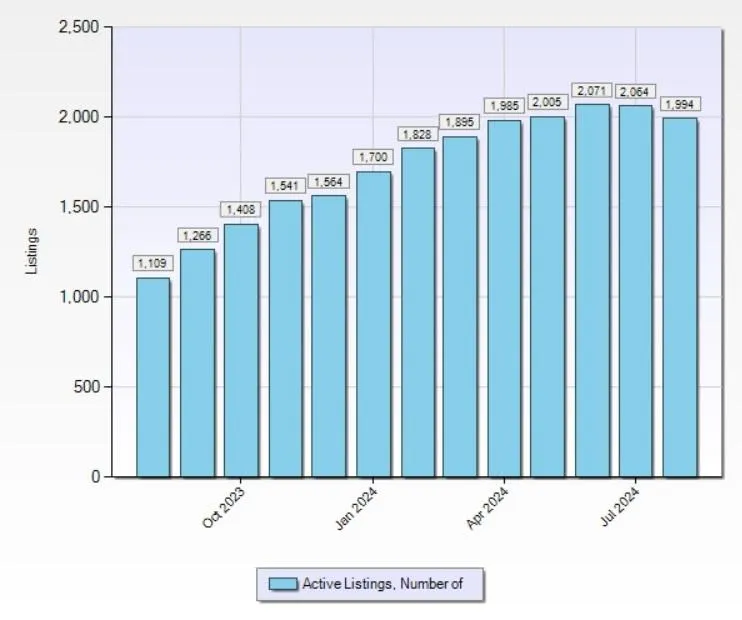
Active listings in real estate refer to the number of homes currently available for sale in a specific market. This statistic provides insight into the supply side of the market, indicating whether there is a high or low inventory of homes. A higher number of active listings generally suggests a buyer's market, while fewer listings indicate a seller's market, affecting pricing and competition.

Graph With Monthly Values
Months of Inventory
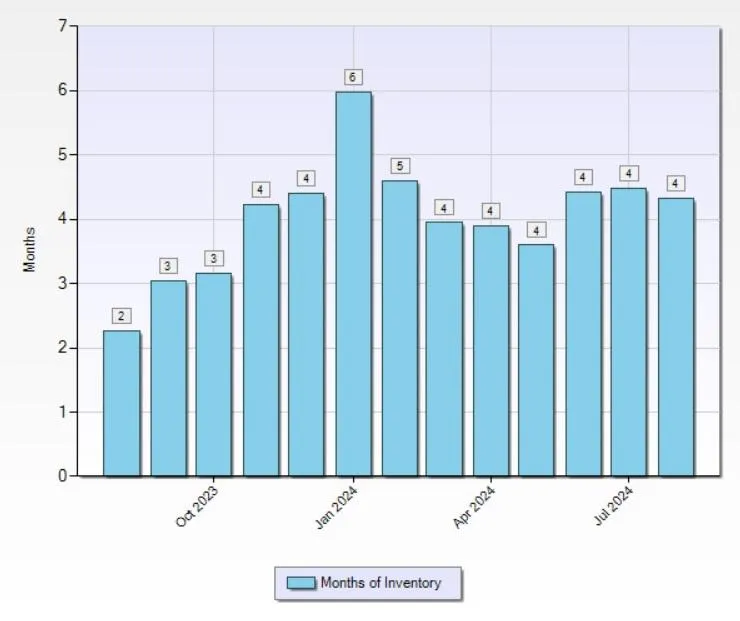
Months of inventory in real estate measures how long it would take to sell all current active listings at the current sales pace, assuming no new listings come on the market. It indicates the balance between supply and demand; lower months of inventory suggest a seller's market, while higher months of inventory point to a buyer's market. This metric helps predict price trends and market competitiveness.

Graph With Monthly Values
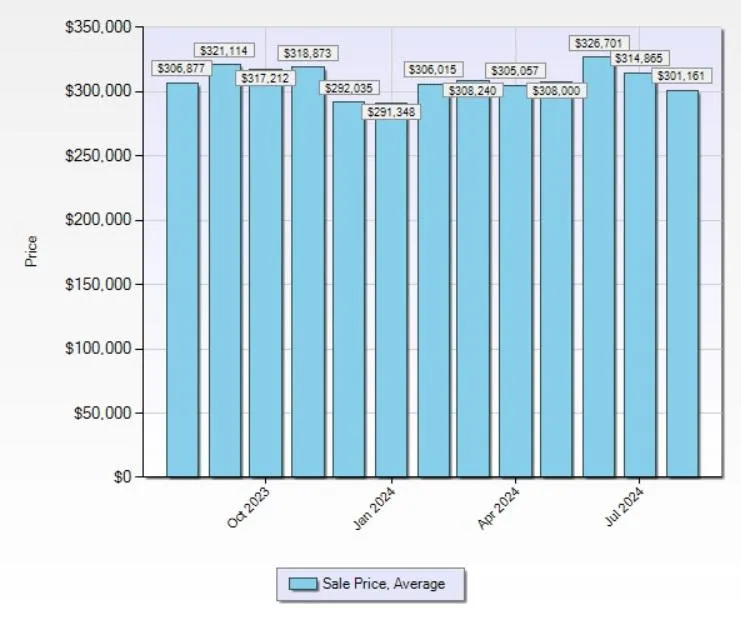
Average Sale Price
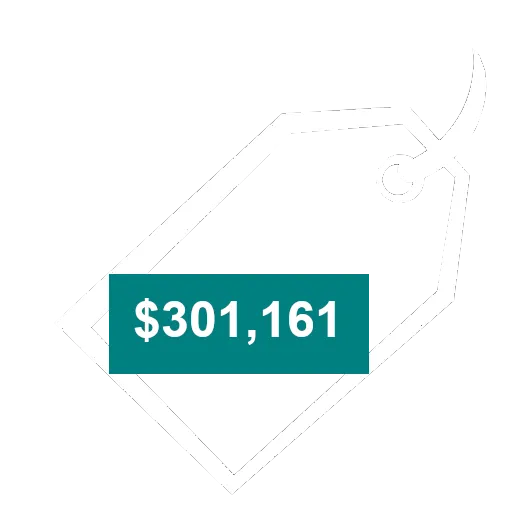
The average sale price in real estate represents the mean price at which properties have sold in a specific area during a given time period. This statistic helps gauge market trends, indicating whether property values are rising or falling. A higher average sale price often suggests a strong demand or higher-value properties being sold, while a lower average sale price may indicate a softer market or more affordable homes being purchased.
Graph With Monthly Values
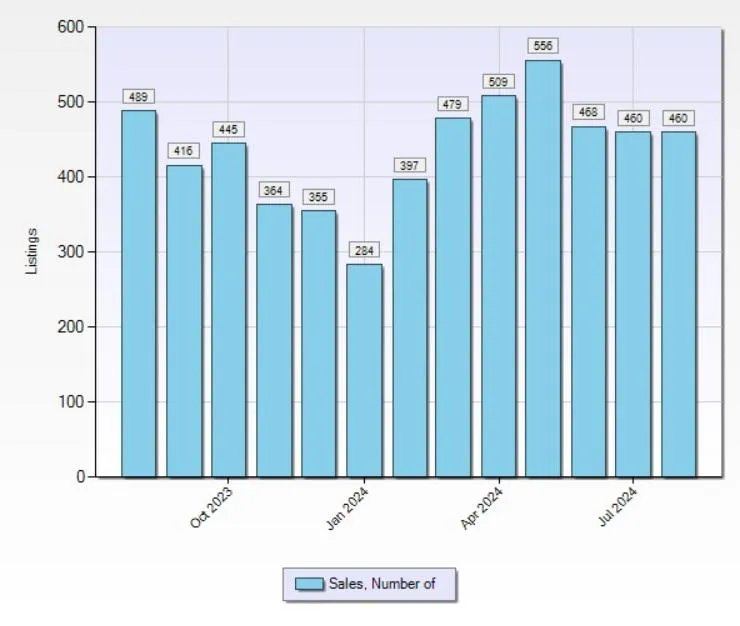
Number of Sales
The number of sales in real estate statistics reflects the total count of properties that have been successfully sold within a specific time period, such as a month or quarter. This metric provides insight into the demand side of the market, indicating how active buyers are and the overall market's health. A higher number of sales typically signals strong demand and a healthy market, while a lower number might suggest weakening demand or seasonal fluctuations.

Graph With Monthly Values
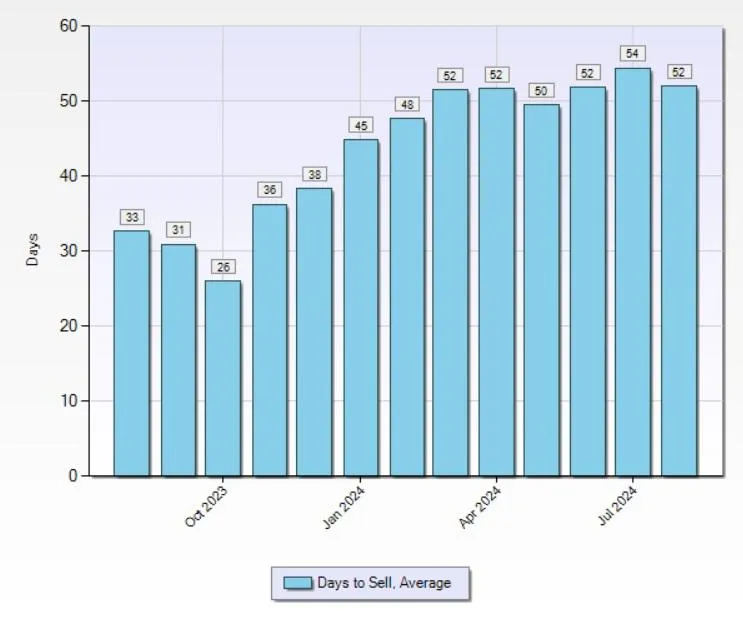
Average Days to Sell
The "days to sell" statistic in real estate measures the average time it takes for a property to go from being listed to being sold. This metric reflects the market's pace; shorter days to sell indicate a fast-moving market, often favoring sellers, while longer days suggest a slower market, potentially benefiting buyers. It helps gauge demand and can influence pricing strategies.

Graph With Monthly Values
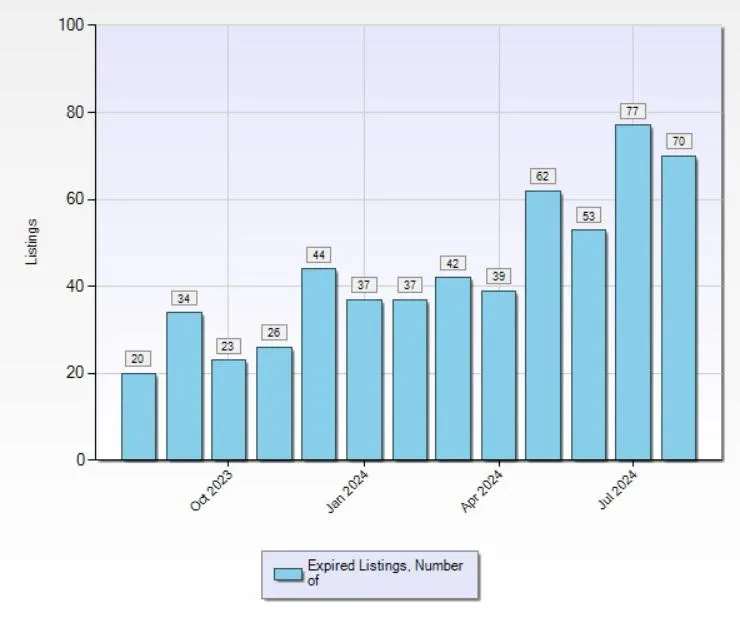
Expired Listings
Expired listings in real estate refer to properties that were listed for sale but did not sell within the contract period, causing the listing to expire. This statistic indicates properties that may have been overpriced, poorly marketed, or in low demand. A high number of expired listings can suggest a slower market or sellers' reluctance to adjust prices to meet market conditions.

Graph With Monthly Values
Market Summary
The West Pasco real estate market has undergone significant changes from August 2023 to August 2024. The number of active listings increased dramatically to 1,994 from 1,109, reflecting a rise of 79.8%. Inventory levels also doubled from 2 months to 4 months, indicating a shift towards a more balanced market with more properties available. Despite this increased supply, the average sale price slightly decreased to $301,161 from $306,877, a reduction of 1.9%, suggesting a cooling in market demand.
Sales activity has slowed, with the number of sales declining to 460 from 489, a drop of 5.9%. Additionally, the average days to sell a property extended from 33 days to 52 days, a 57.6% increase, pointing to a longer time needed to find buyers. The number of expired listings also rose significantly to 70 from 20, a 250% increase, indicating that more properties failed to sell within the expected time frame.
Several factors contribute to these changes in the market. First, increased inventory levels suggest more homeowners are listing their properties, possibly due to economic uncertainty or an attempt to capitalize on previously higher prices. Second, the decrease in average sale prices and longer time on the market may be driven by buyer hesitation, potentially caused by higher interest rates and inflation concerns. Finally, shifting economic conditions, such as changes in employment rates and consumer confidence, likely impact both buyer behavior and market dynamics, resulting in slower sales activity and a greater number of expired listings.
Overall, the West Pasco market appears to be adjusting to new economic realities, with signs of cooling demand and a shift towards more balanced conditions.

